Interested in finding out exactly how much of our energy we get from renewables on a global scale? Our infographic below sums up the most interesting facts and figures, using the most recent figures we can source as of 2024.
You can find the full sources for these figures later on in the article.
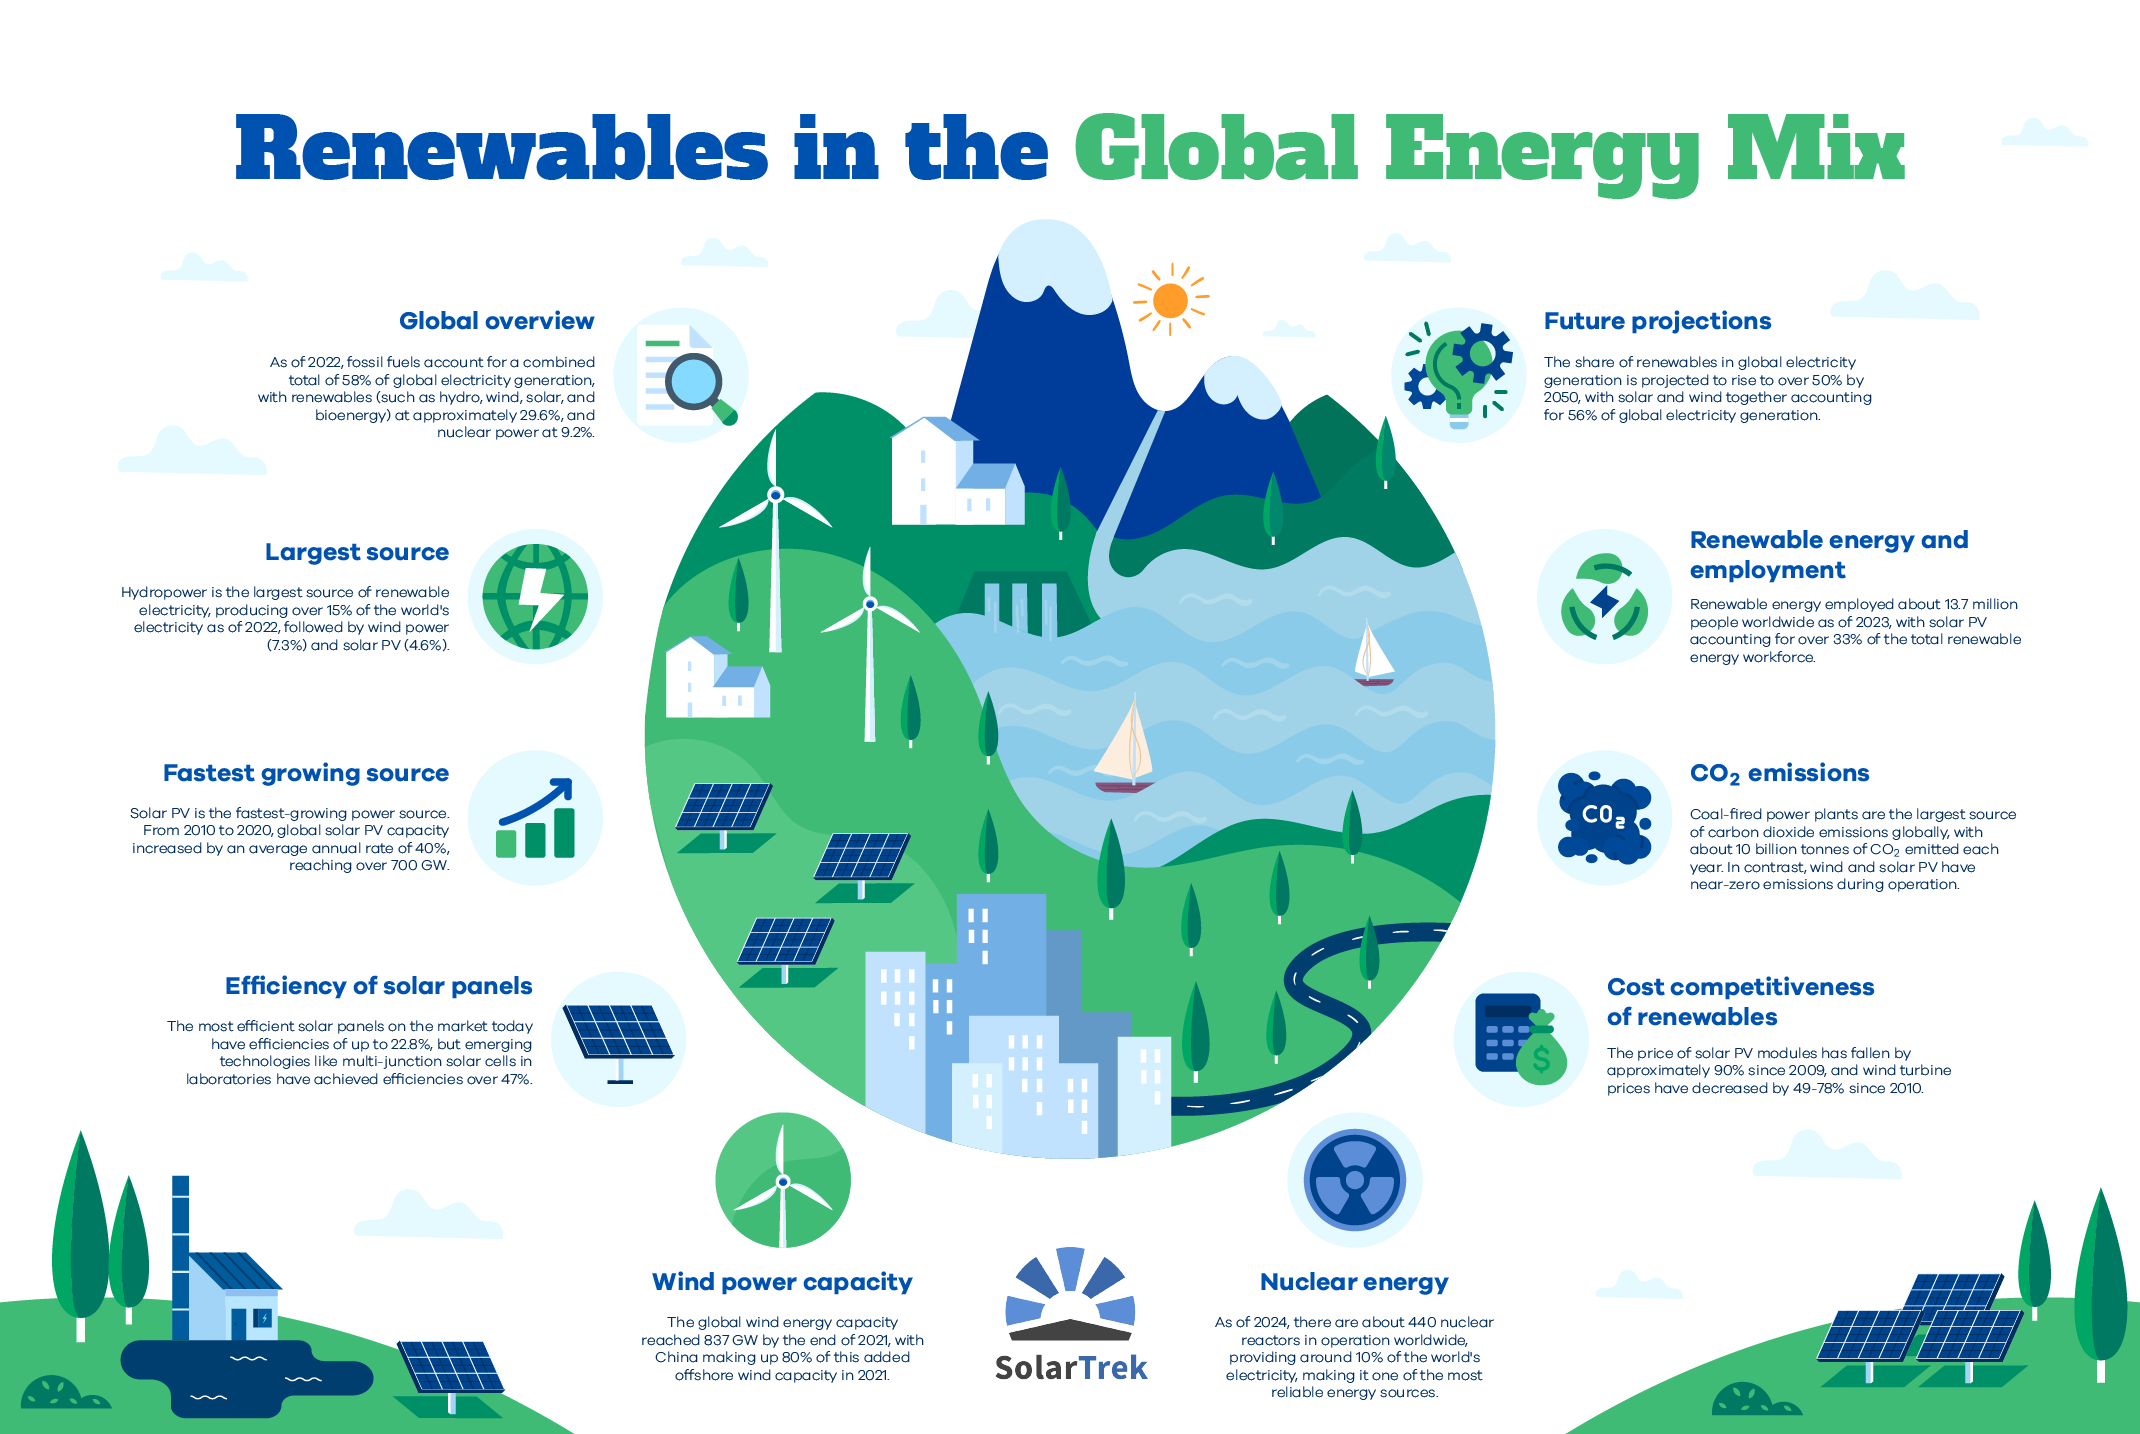
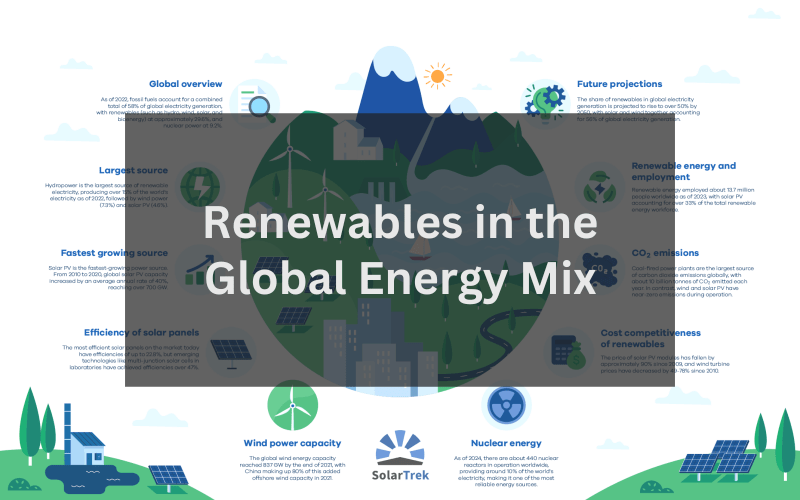
1. Global Overview
As of 2022, fossil fuels account for a combined total of 58% of global electricity generation, with renewables (such as hydro, wind, solar, and bioenergy) at approximately 29.6%, and nuclear power at 9.2%.
(Source: Statista)
2. Largest Source
Hydropower is the largest source of renewable electricity, producing over 15% of the world’s electricity as of 2022, followed by wind power (7.3%) and solar PV (4.6%).
(Source: Our World in Data (Renewable Energy))
3. Fastest Growing Source
Solar PV is the fastest-growing power source. From 2010 to 2020, global solar PV capacity increased by an average annual rate of 40%, reaching over 700 GW.
4. Efficiency of Solar Panels
The most efficient solar panels on the market today have efficiencies of up to 22.8%, but emerging technologies like multi-junction solar cells in laboratories have achieved efficiencies over 47%.
5. Wind Power Capacity
The global wind energy capacity reached 837 GW by the end of 2021, with China making up 80% of this added offshore wind capacity in 2021.
(Source: Global Wind Energy Council (GWEC))
6. Nuclear Energy
As of 2024, there are about 440 nuclear reactors in operation worldwide, providing around 10% of the world’s electricity, making it one of the most reliable energy sources.
(Source: World Nuclear Association)
7. Cost Competitiveness of Renewables
The price of solar PV modules has fallen by approximately 90% since 2009, and wind turbine prices have decreased by 49-78% since 2010.
8. Carbon Dioxide Emissions
Coal-fired power plants are the largest source of carbon dioxide emissions globally, with about 10 billion tonnes of CO2 emitted each year. In contrast, wind and solar PV have near-zero emissions during operation.
(Source: Global Carbon Project)
9. Renewable Energy and Employment
Renewable energy employed about 13.7 million people worldwide as of 2023, with solar PV accounting for over 33% of the total renewable energy workforce.
10. Future Projections
The share of renewables in global electricity generation is projected to rise to over 50% by 2050, with solar and wind together accounting for 56% of global electricity generation.
(Source: Bloomberg New Energy Finance (BNEF))

Feel free to share this infographic or use for your own non-commercial applications and publications – we just ask that you credit us at solartrek.us!